New Delhi: It’s that time of the year again when cities across India are being assessed on the basis of their Swachh quotient. From building toilets to starting door to door waste collection in order to manage 100 per cent waste and improve basic sanitation and hygiene levels in the areas, the municipal corporation of all the cities are doing their best to perform better and attain the title of the ‘Cleanest City’ of India. The government began this year’s Swachh Survekshan from January 4 and will carry it till March 10.
Here are some of the key differences in this survekshan, which is being touted by the government as the world’s largest cleanliness survey.
How Many Cities Are Covered?
2018: This Swachh Survekshan will cover for the first time all 4,041 Indian cities that has a population of 40 crore, that’s almost 10-fold increase from last year’s survey and thus the government is calling this as world’s largest cleanliness survey.
This year, 500 cities will be ranked on national level which has more than 1 lakh population, while 3,541 cities with less than 1 lakh population will have State and Regional ranking.
2017: Last year only 434 cities and towns with a population of 1 lakh and above were covered in the survey.
Parameters On Which Cities Are Ranked?
2018: This year the survey attempts to capture the progress in 6 broad parameters –
a. Collection and Transportation of Municipal Solid Waste: This criteria is to know whether in the respective area segregated dry and wet waste is being collected daily from the households and if the public areas are clean or not
b. Processing and Disposal of Municipal Solid Waste: This area will capture the progress of the cities on how effectively they process their waste and recycle it
c. Sanitation Related Progress: This is to verify whether the city has achieved the ODF tag and if not, then what has been the development in the area is in one year. This year, access to toilets in the Petrol Pumps will also be included in the progress report
d. IEC (Information, Education and Communication): Through this area survey will assess the cities on whether they have started campaigns promoting Swachh Survekshan or have started engaging citizens in waste management programmes, maintenance of Community and Public Toilets, to name a few.
e. Capacity Building: This area will assess whether officials in the ULBs were provided sufficient opportunities to attend trainings and go for exposure visits
f. Innovation and Best Practices: For the first time, this new component is being added in the list of parameters to rank the cities. Through this criteria, survey will assess all the cities on the way they have incorporated the innovative and creative methods in order to achieve sustainable solutions in their area.
2017: Last year, cities were assessed on five parameters — ODF status of the city and the developments on the construction front of the toilets; the waste collection, sweeping and transportation system in the area to see whether the area is clean or dirty; municipal solid waste processing and disposal system to know how well the area manages the waste they create and information, education and behavioral change activities to know how well people know about India’s biggest cleanliness drive – swachh bharat abhiyan.
Weightage Criteria In Which Cities Are Ranked?
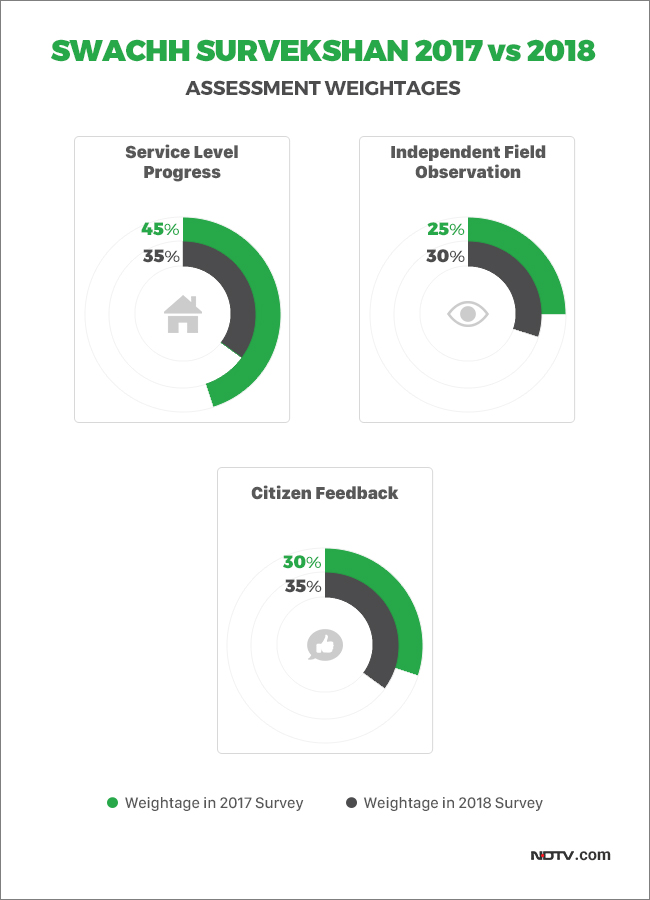
2018: This year all the cities will be ranked out of the total of 4,000 marks. Over 1200 marks are being kept for direct observation while 1400 marks each will be granted on the basis of citizen feedback and service level progress.
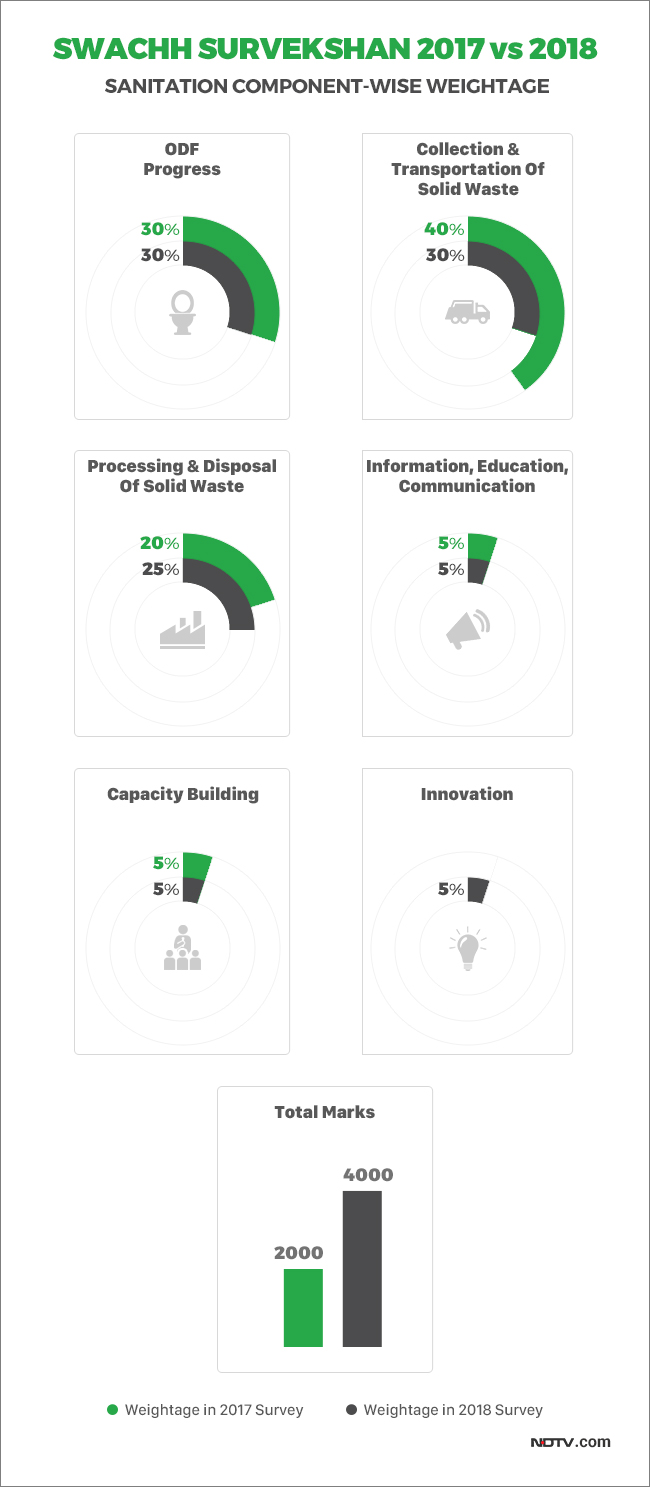
Speaking about the sanitation components, ‘Processing and Disposal’ criteria weightage has been increased by 5% from last year and this time cities will be marked on condition of their landfills, percentage of wet and dry waste they are treating effectively and percentage of biodegradable waste discarded onto the landfills, remediation of existing dumpsites undertaken, sale of city compost in last two quarters of 2017, and so on. Whereas, Collection and Transportation of Solid Waste criteria weightage has been decreased by 5% from last year.
2017: Last year, the cities were ranked out of the total of 2,000 marks in which 900 marks were for municipal bodies’ data, 500 marks for direct observation and 600 for direct citizen feedback.
Conclusion
The major difference in Swachh Survekshan from last year is the weightage criteria. From 2017, the total score has been doubled this time to avoid crowding of cities with very marginal differences in scores that happened in the previous survey. Another major difference is the inclusion of a new category – Innovation and Creative methods adopted by the city in the evaluation process. The new category has been allotted 5% weightage.
Apart from this, Citizen Feedback has been given more importance just like last year. A 35% weightage is being given to this category from 30% in 2017.
The survey will continue till March 10 and survey results are scheduled to be announced in May, 2018.










Sarah
January 19, 2018 at 11:45 pm
All the left wing media must keep in media that for 66 years, left wingers ruled this country and did not construct toilets and basic hygiene. So, before you run after the new govt, you must grill the left wing politicians for their failure to build public toilets and hygiene and if you can’t do that, just quit journalism.
Sunny Sahota
January 20, 2018 at 2:57 pm
In our Chandigarh and around, the garbage and pollution level is as usual. Not even 1 percent progress has been made. Nothing has changed here at all. I wonder who made this erroneous report…
Anumakonda Jagadeesh
January 22, 2018 at 9:07 am
Mere Propaganda and misuse of public money. What is needed is Individual’s concern on Cleanliness. As Mahatmaji said,”Cleanliness is next to Godliness”. Some “Eat in private and ease in public” The mindset has to be changed. Pollution has to be tackled on a war footing but not POLLution!There are tree planting programs. More paraphernalia on inauguration of the programme but later no care. In China One family one tree. In Beijing City alone millions of trees. I have been championing the cause and use of controlling CO2 accumulation and water vapour in the atmosphere by planting CAM plants like Opuntia(Cactus) and Agave. Crassulacean acid metabolism, also known as CAM photosynthesis, is a carbon fixation pathway that evolved in some plants as an adaptation to arid conditions.[1] In a plant using full CAM, the stomata in the leaves remain shut during the day to reduce evapotranspiration, but open at night to collect carbon dioxide (CO2). The CO2 is stored as the four-carbon acid malate in vacuoles at night, and then in the daytime, the malate is transported to chloroplasts where it is converted back to CO2, which is then used during photosynthesis. The pre-collected CO2 is concentrated around the enzyme RuBisCO, increasing photosynthetic efficiency. Everybody can plant one of these at least. They thrive with less water and in fact called desert plants.C02 Excess as well as water vapour in atmosphere results in temperature rise.
Dr.A.Jagadeesh Nellore(AP)